MacroScope Weekly, August 9, 2026
Current Regime: Reflation / Contracting Liquidity
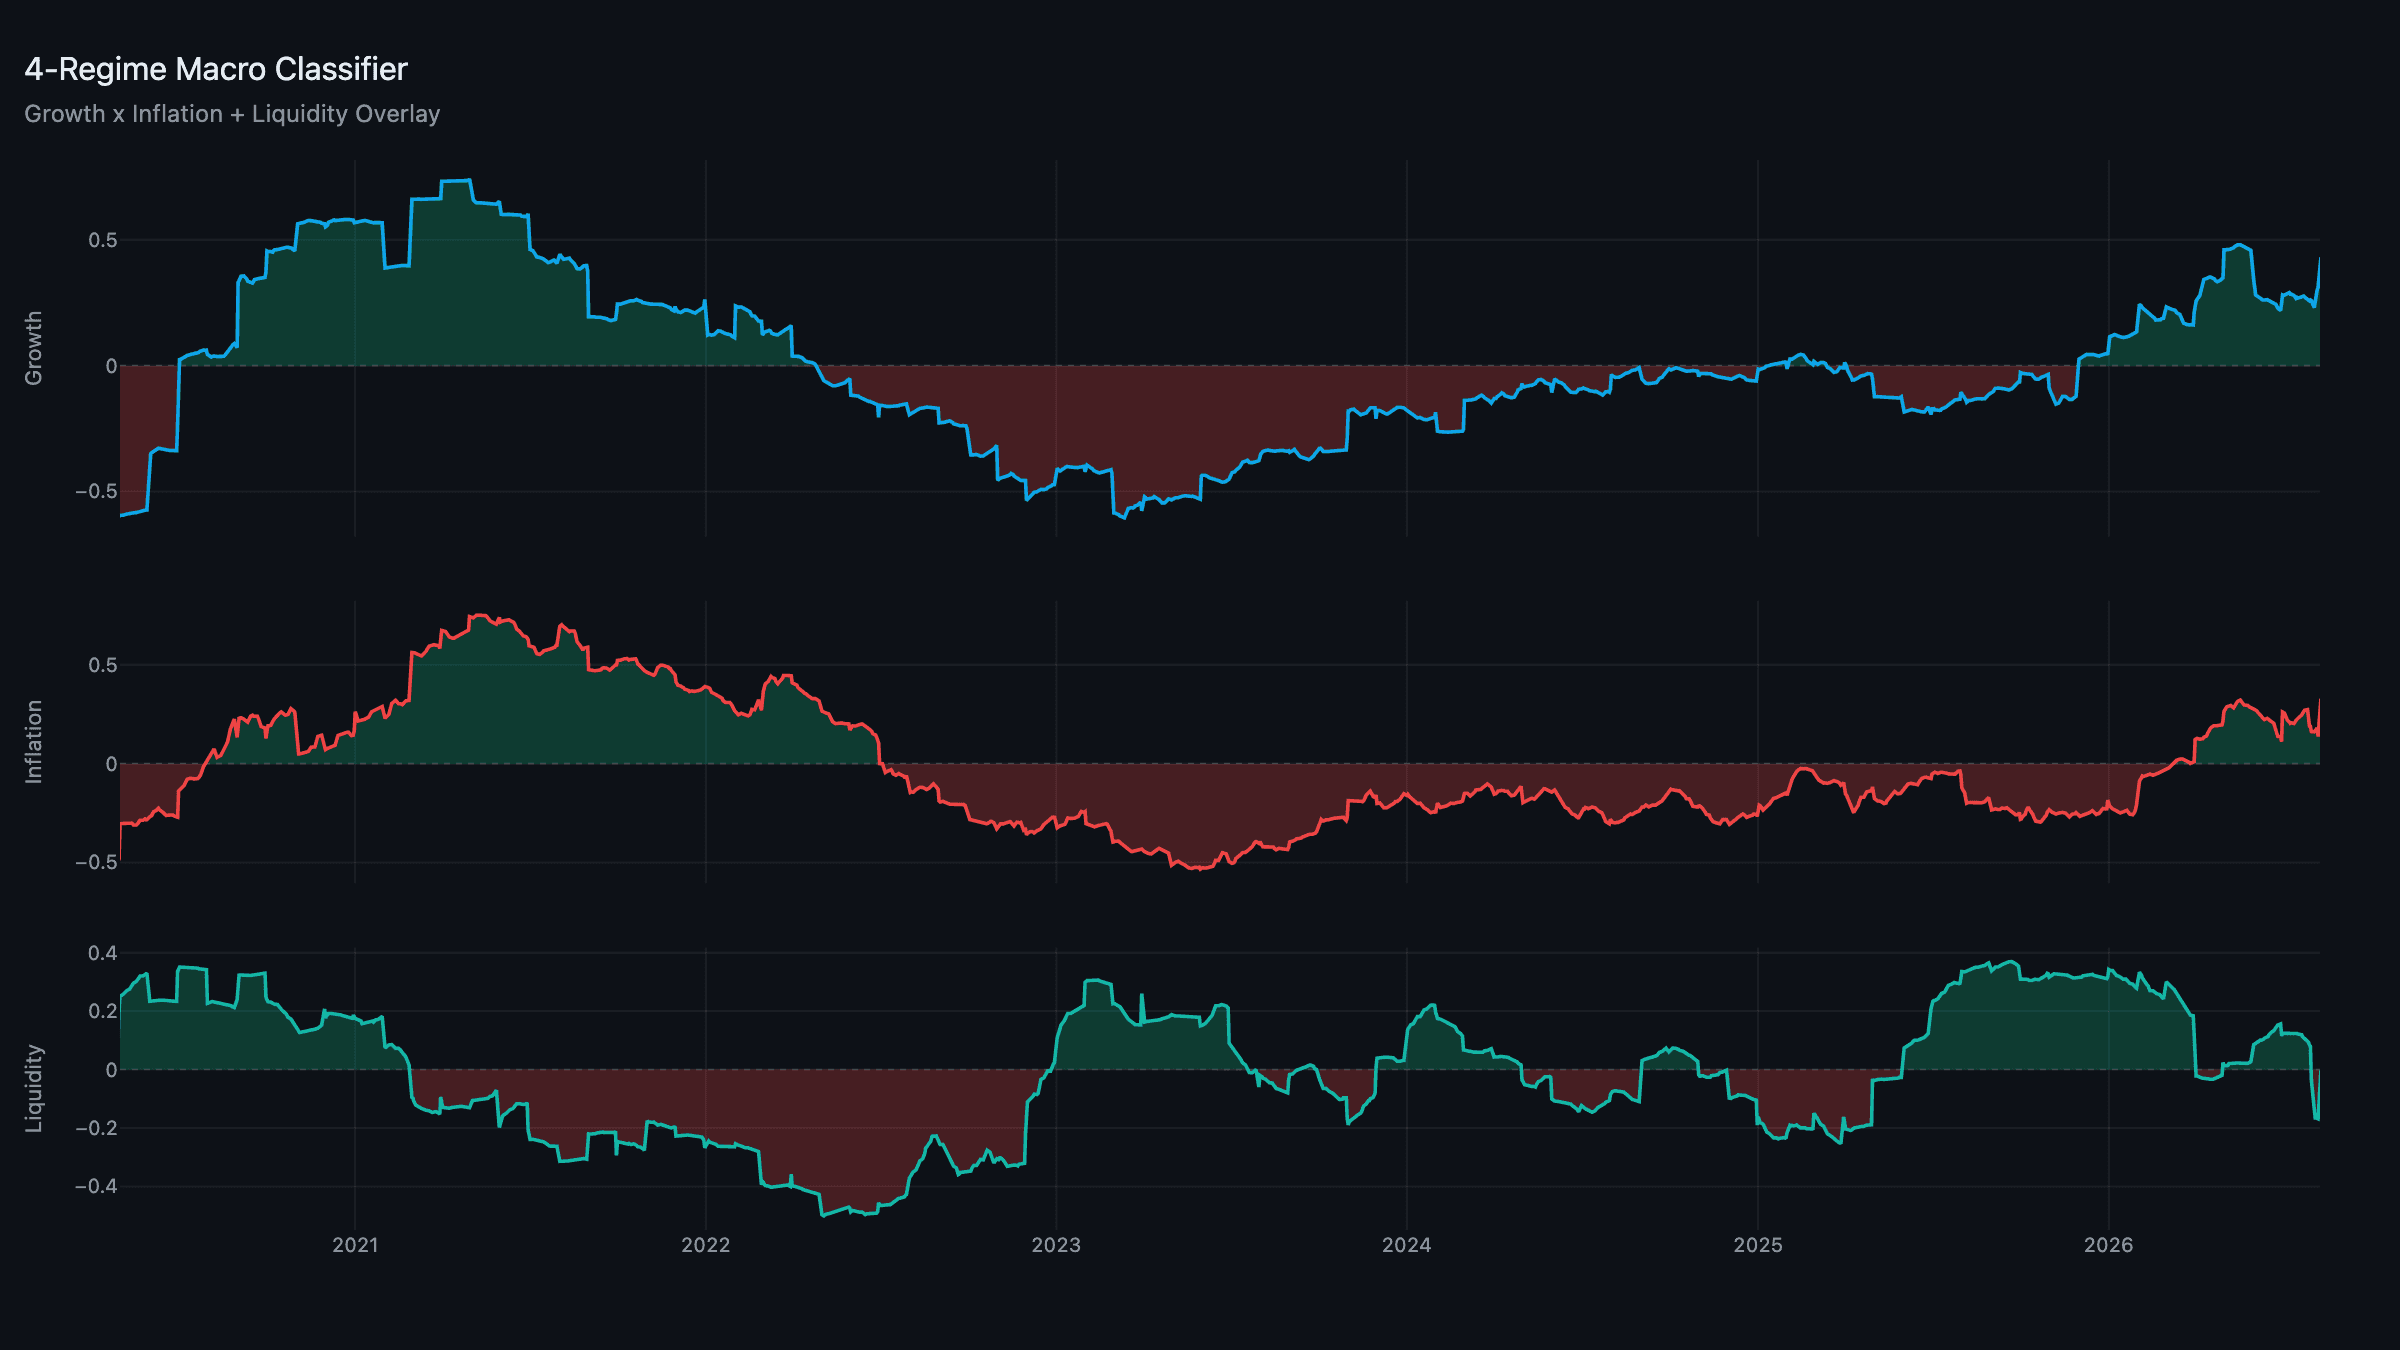
In short: Reflation / Contracting holds for a second week, but the composites moved further apart under the hood: growth jumped to +0.43 from the low 0.2s, inflation eased to +0.14 from the high-0.17s, and liquidity slipped further negative to -0.13. The August rebalance settled less defensively than it looked like it would when we wrote last week. The real-assets sleeve came back online (VNQ + XLE), so cash reverted to its 25% base weight instead of the 55% the sleeve's temporary unavailability had forced. Simulated backtest stats improved to 17.0% CAGR / 1.26 Sharpe / 1.62 Calmar / -10.5% max drawdown. On the news side: DRAM is turning into the next real AI bottleneck, with Samsung, SK Hynix and Micron so dominant that South Korea intervened to limit trading in leveraged KOSPI ETFs, and rising DRAM prices are already showing up in consumer electronics. The "who actually monetizes AI" question is starting to matter more than the "who builds it" question. The equity-overexposure worry gets pushed back on. The US is quietly helping Japan defend the yen through FIMA repo rather than Treasury sales, which is really balance-sheet management dressed up as friendship. A hedge fund got nearly wiped out by an over-levered, single-name AI bet. SpaceX volatility continues on lockup and earnings noise. Gold's rally reads to us as a growth-and-money-supply story, not a Fed-credibility story, and a rate hike is possible but unlikely, with the debt-refinancing math still the Fed's real constraint.
Composites: Growth Breaks Higher, Liquidity Digs In Negative
Growth jumped to +0.43, up sharply from the ~0.17 to 0.32 range it held through the back half of last week, with most of the move landing in a single session on August 7th, consistent with a data-refresh inflection rather than a smooth grind. The decision pillar (P2) did the heavy lifting, up to +0.41 from +0.33, while input acquisition (P3) and production (P4) stayed firm in the high 0.7s-0.8s. Inflation eased to +0.14 from the high-0.17s, with the composite reweighting lower on the same day growth jumped. Demand pressure and pipeline costs both firmed slightly, but expectations and services inflation stayed comfortably negative and pulled the composite down. Liquidity kept sliding, now -0.13 versus -0.04 to -0.23 the prior two weeks, driven by private credit (P2) falling to +0.33 from +0.45 and collateral & funding (P5) grinding further negative to -0.62.
The regime holds at Reflation / Contracting, the same label as last week, but the internals are diverging harder: growth is now the strongest read since the current cycle began, inflation continues to cool, and liquidity is digging a deeper hole rather than stabilizing after its first negative print. That combination (strong growth, contained inflation, tightening liquidity) is the one where the framework's weighting scheme leans defensive by construction even as the growth data itself looks unambiguously good, and it's worth sitting with that tension rather than resolving it prematurely.
The Portfolio: Less Defensive Than It Looked Last Week
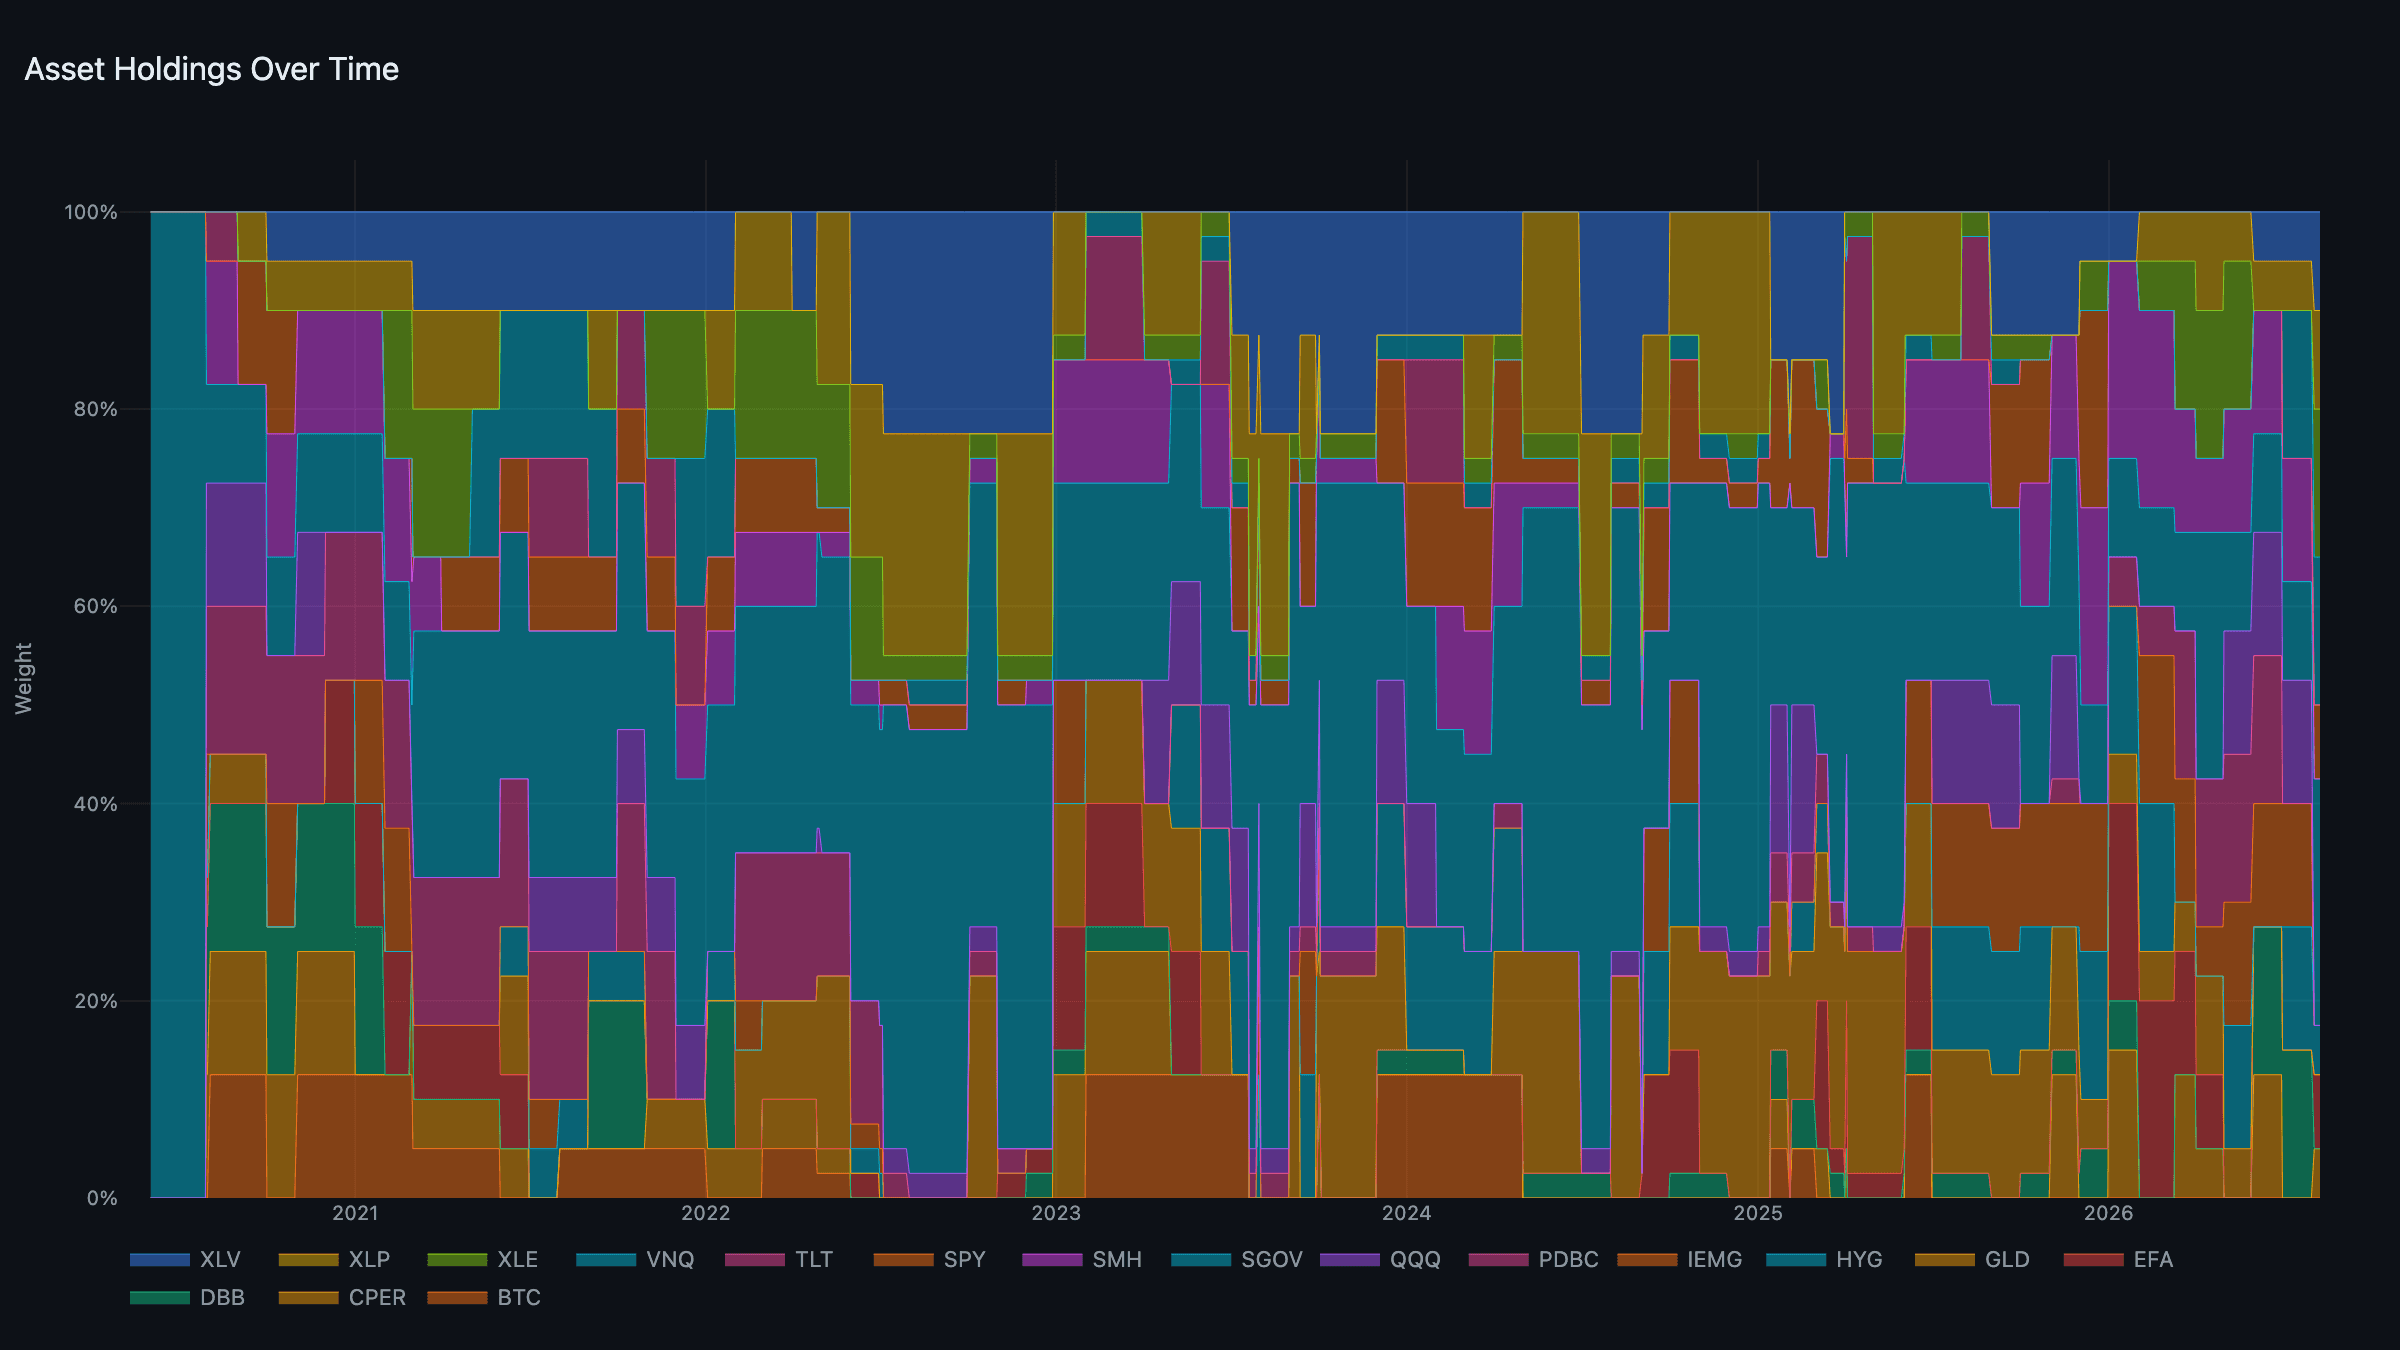
Last week we flagged that the real-assets sleeve had come back unavailable for the August 1st tournament, forcing its full 30% weight to cash and pushing the book to 55% cash. By the time the rebalance actually settled, the sleeve's signal was computable again. DBB's momentum read simply hadn't finished refreshing when we wrote the prior letter. The book that's actually in place:
- Cash: SGOV, 25%, back to the Reflation/Contracting base weight, not the inflated 55%.
- Real assets: VNQ + XLE, 15% each. The sleeve rotated out of DBB and into XLE, a real-economy read that leans more directly on energy than industrial metals this cycle.
- Defensive: XLV + XLP, 10% each.
- Growth: EFA + SPY, 7.5% each. SMH rotated out in favor of SPY, trimming the semis-specific volatility that was the growth sleeve's main watch item last week.
- Liquidity: CPER + HYG, 5% each.
Simulated backtest stats improved to 17.0% CAGR, 1.26 Sharpe, 1.62 Calmar, and a -10.5% max drawdown, a cleaner set of numbers than the cash-heavy book we described last week, and a good reminder that a single day's data snapshot mid-cycle can overstate how defensive the actual rebalance ends up. The next tournament run isn't until September 1st, so this is the book that carries through the rest of August.
News: DRAM Becomes the New Bottleneck, Japan's Quiet Bailout, and Gold's Real Signal
DRAM is turning into the next binding constraint on AI scaling, and the market is starting to price it that way. The logic is straightforward: bigger context windows and more capable models need more memory to actually hold and use information when generating an answer, which makes DRAM as load-bearing to the next leg of AI progress as GPU compute itself. The supply side is concentrated to an extreme degree (Samsung Electronics, SK Hynix and Micron effectively are the DRAM market) and that concentration is exactly why South Korea's government stepped in last week to limit access to some of the more heavily levered ETFs tracking these names, given how much of the KOSPI's weight sits in this handful of stocks. The second-order effect is the one that matters for the inflation composite: rising DRAM prices flow directly into consumer electronics costs, and with the shortage looking structural rather than cyclical, that's a pipeline-costs pressure point worth watching even as the broader inflation read keeps cooling.
The AI trade may be entering its third phase, and it's worth thinking now about who wins it. Since ChatGPT's 2022 debut, the market first rewarded the labs building models, then rotated to the chipmakers supplying them. The logical next step is rewarding the companies that actually adopt AI well enough to turn it into measurable growth, not just talk about efficiency gains, but ship them. The interesting question isn't whether this rotation happens, it's the timing and the winners: which companies move fast enough on integration to capture the productivity gain before it gets competed away, and whether that ends up being incumbents with the data and distribution to deploy AI at scale, or leaner challengers unencumbered by legacy process. We don't think this is resolved yet, but it's the framework worth watching the next few quarters through.
The "investors are overexposed to equities and need to hedge" narrative is getting louder, and we're not convinced it's the risk it's being framed as. The alternative read is simpler: investors are recognizing that persistent money creation makes holding cash a slow bleed, and that putting capital to work is the only way to actually gain ground against that dilution. Most of that capital is flowing toward technology specifically because that's where the multi-decade growth case looks clearest. That's a rational allocation response to a real monetary backdrop, not a crowded trade waiting to unwind. Concentration risk is real, but "people are buying the thing they think will compound the fastest" isn't the same problem as a bubble built on nothing.
The US is helping Japan defend the yen, and the mechanics tell a more interesting story than the official one. The public framing was friendship. Trump called it a favor for an ally, Bessent talked up "close coordination." But instead of Japan selling Treasuries outright for dollars to buy yen, the New York Fed sold euros for yen on Treasury's behalf, while the Fed's FIMA repo facility let Japan borrow dollars against its Treasury holdings as collateral rather than dumping the bonds themselves. Japan holds north of a trillion dollars in Treasuries, and with yields already sensitive and term premium elevated, the last thing Washington wants is a forced seller of that size showing up in the bond market. Read that way, this looks less like a favor and more like Bessent engineering a way for Japan to defend the yen without touching UST supply: friendship narrative for the cameras, balance-sheet management underneath.
A hedge fund came close to getting wiped out this week, and it's a clean case study in the difference between conviction and leverage. Being "irresponsibly long" AI is a defensible bet on the underlying trend. The problem here wasn't the direction, it was concentrating almost the entire book in a single position and running it with leverage on top. The fund survived the correction, barely, but the lesson generalizes well beyond this one case: even when the underlying thesis is right, sizing and diversification are what determine whether you're still solvent by the time you're proven correct.
SpaceX volatility continued this week, mostly to the downside, on a mix of lockup expirations and earnings-related noise. None of this changes the underlying business case. It reads as the normal mechanical process of a large, newly liquid stock finding its trading range as insiders realize positions and the market prices a full quarter of real numbers for the first time. We'd expect this to stabilize over the next couple of months as the technical overhang clears, and most of the near-term moves are already being arbitraged by larger funds rather than reflecting a genuine reassessment of the company.
Gold's rally looks to us like a growth-and-money-supply story, not a Fed-credibility story. One read of gold pushing higher is that investors don't trust the Fed to control inflation. We don't buy that version. The short-term spike in energy prices tied to the Iran situation isn't large enough on its own to force a hiking response, and assuming that conflict stays contained, it shouldn't need to be. The more compelling explanation is a weakening dollar combined with continued global money-supply growth having a bigger near-term impact on gold than elevated real yields would otherwise suggest, plus a genuine bet on AI-driven growth continuing rather than a bet against the Fed. On the trend in global money supply, gold has been floated as eventually reaching a $20,000 target over the coming years. A number that sounds extreme in isolation but is less so against the backdrop of how much monetary base has been created this cycle.
A rate hike over the coming months is possible, but we still think it's the less likely path. Inflation expectations sitting above anything seen since the post-COVID spike is a real input, and a hike would help reanchor those expectations and rebuild some Fed credibility, credibility that, as we've said before, isn't exactly abundant right now regardless. But we don't think that's the primary problem this Fed is solving for. Cheap debt refinancing should take precedence over an inflation-expectations fight, and that's plausibly exactly why Warsh has been floated as wanting to redefine how inflation gets measured, a faster, more direct route to the same goal that a hike would take much longer and cost much more to reach. It would come at the cost of Fed credibility, though there isn't much of that left to spend in the first place.
Week Ahead
- Liquidity's negative trend: Now two straight weeks in Contracting territory, with private credit and collateral/funding both worsening. Watch whether this stabilizes or keeps grinding lower.
- DRAM and the inflation composite: Whether rising memory-chip costs show up meaningfully in the pipeline-costs channel as consumer electronics prices adjust.
- KOSPI and the levered-ETF restrictions: Whether South Korea's intervention contains the volatility or just delays it, given how concentrated the index is in the same three DRAM names.
- Real-assets sleeve stability: Whether VNQ + XLE holds through September 1st or the signal disruption that briefly took the sleeve offline recurs.
- Gold's path toward higher levels: Whether the dollar-weakness and money-supply drivers we think are behind the move continue, or whether a Fed-credibility narrative starts to dominate instead.
All model scores are normalized to a [-1, +1] scale through our proprietary normalization methodology. Positive readings indicate above-trend expansion. Negative readings indicate below-trend contraction. Data updated through August 7, 2026.
MacroScope models are systematic tools, not investment advice. Past performance does not guarantee future results.