MacroScope Weekly, March 22, 2026
Current Regime: Goldilocks / Expanding Liquidity
In short: The FOMC held and delivered a hawkish dot plot (only one cut now penciled for 2026, pushed to September) and Brent settled near $101 after Houthi strikes on Saudi Aramco facilities disrupted Red Sea routes. Yet the framework still reads Goldilocks / Expanding: the inflation composite stays negative because the energy spike isn't broadening, and liquidity is still expanding. Growth is softening at the margin but holding positive. The book remains risk-on, globally tilted.
The Regime: Goldilocks Holds
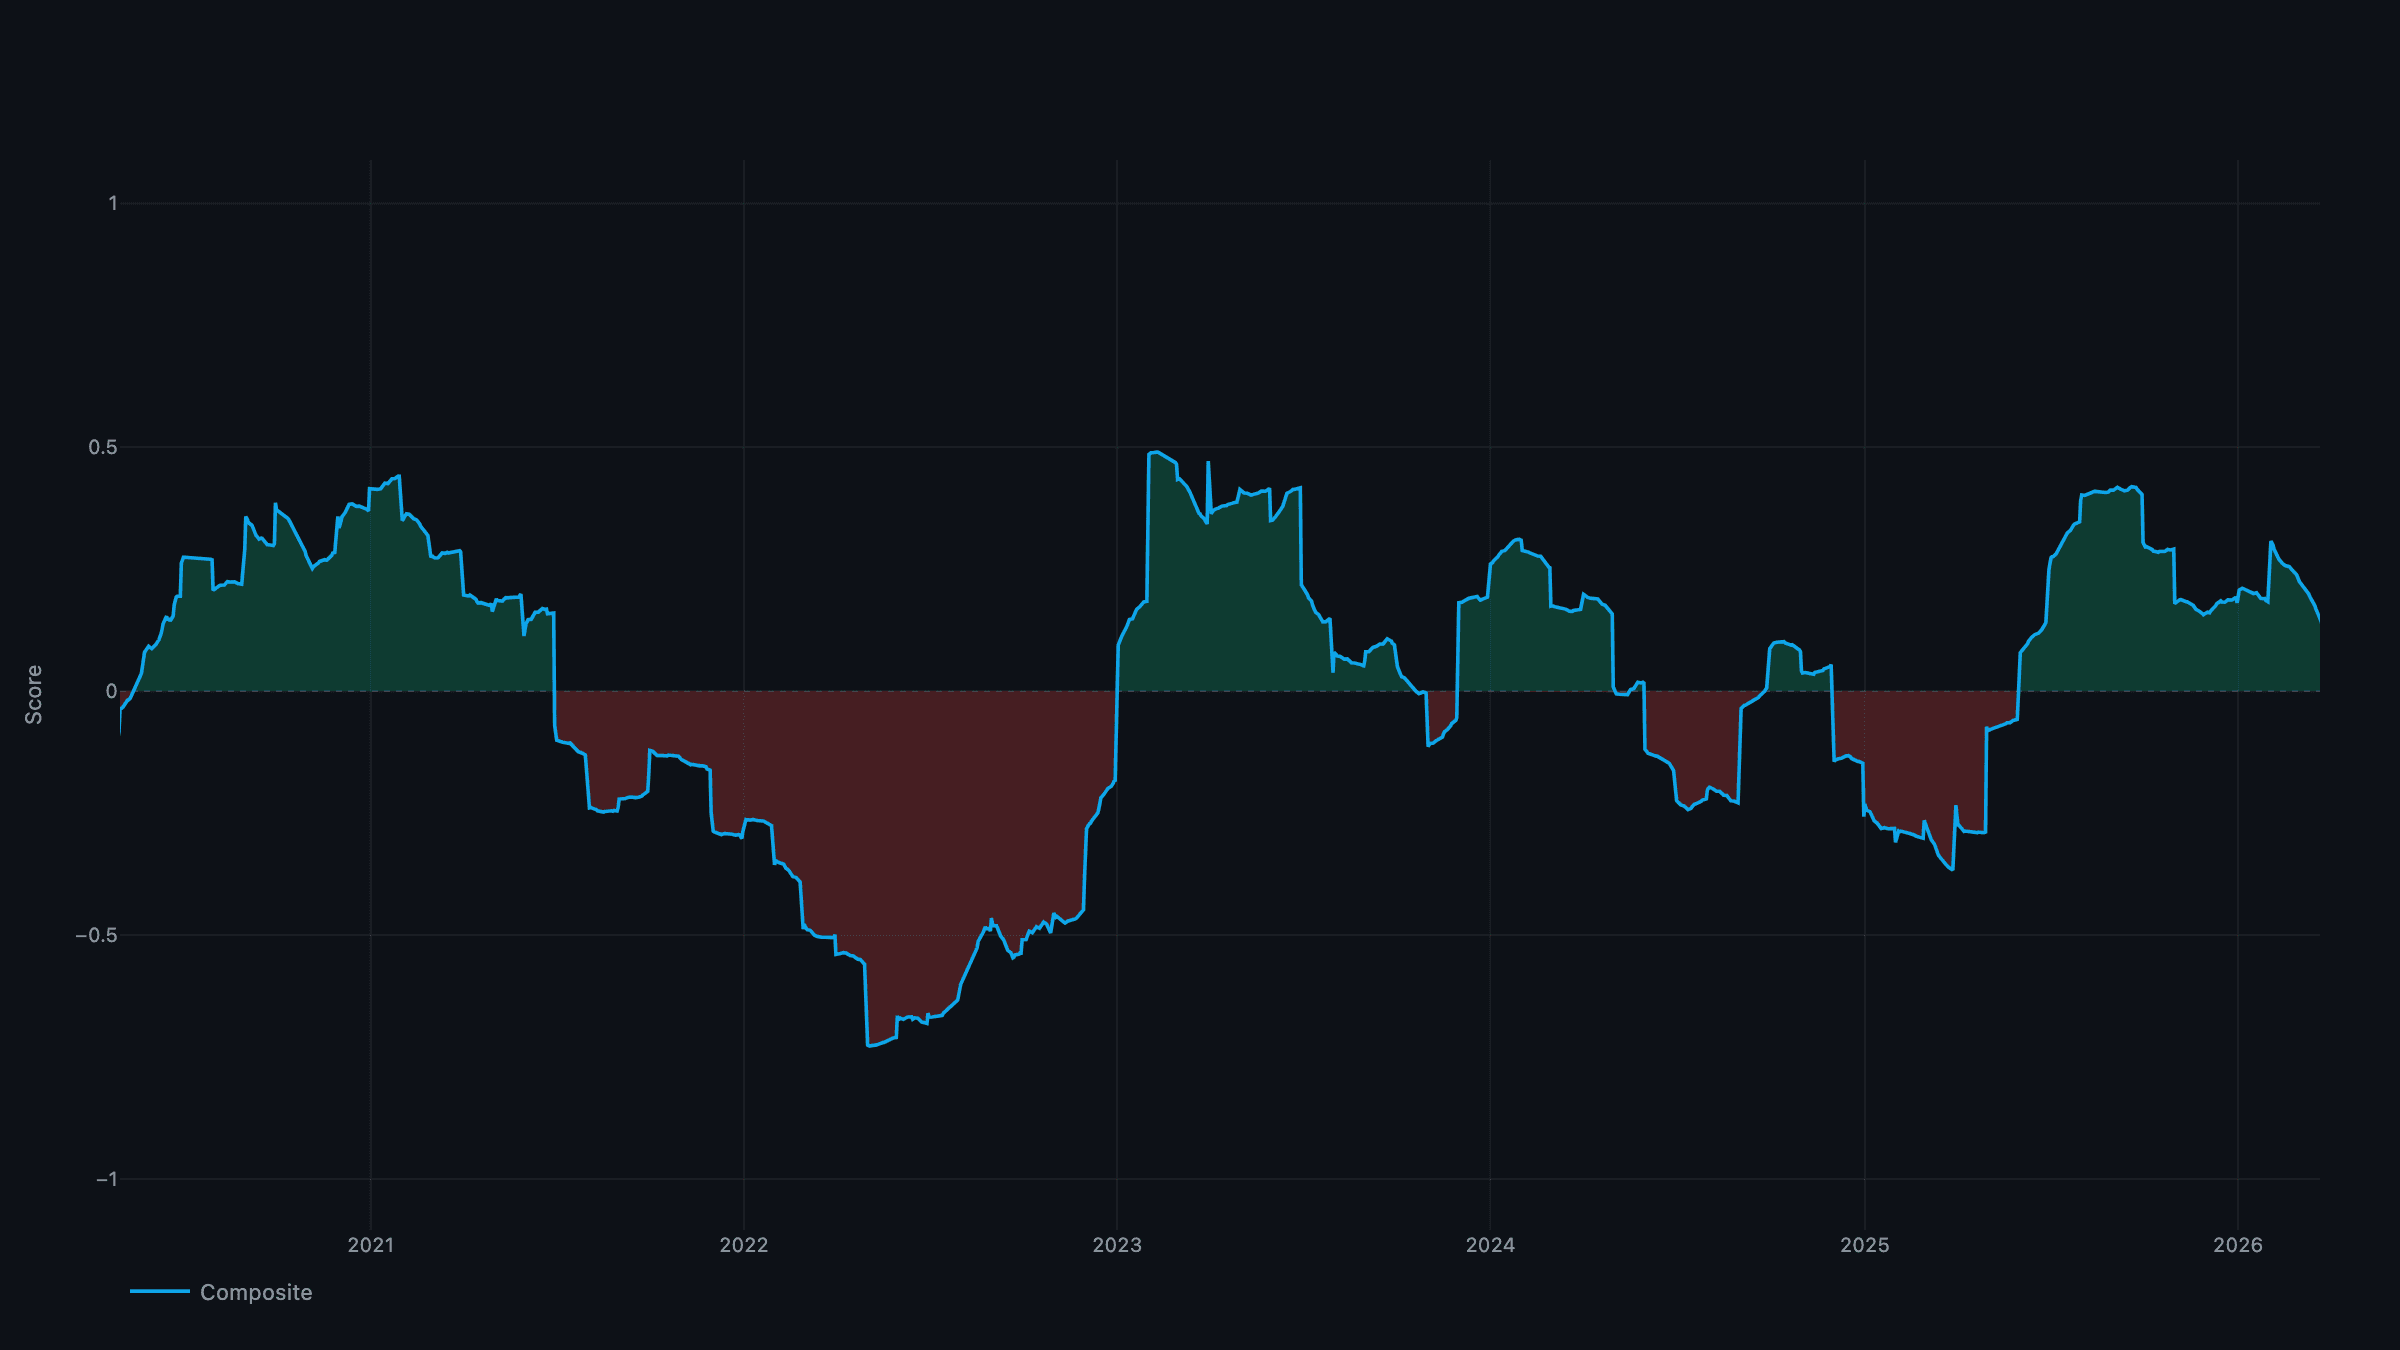
Growth: +0.16 | Inflation: −0.13 | Liquidity: +0.16
A hawkish Fed and $101 oil sound like a Reflation setup, but the composite math says otherwise. The inflation read is still negative because pressure isn't broad: oil and producer prices are pushing the pipeline channel up, but services inflation remains disinflationary and demand pressure is negative. Until the energy shock leaks into expectations and wages, the aggregate sits below trend, and growth-positive plus inflation-negative is Goldilocks. Liquidity, despite the hawkish repricing, is still expanding at the quantity level.
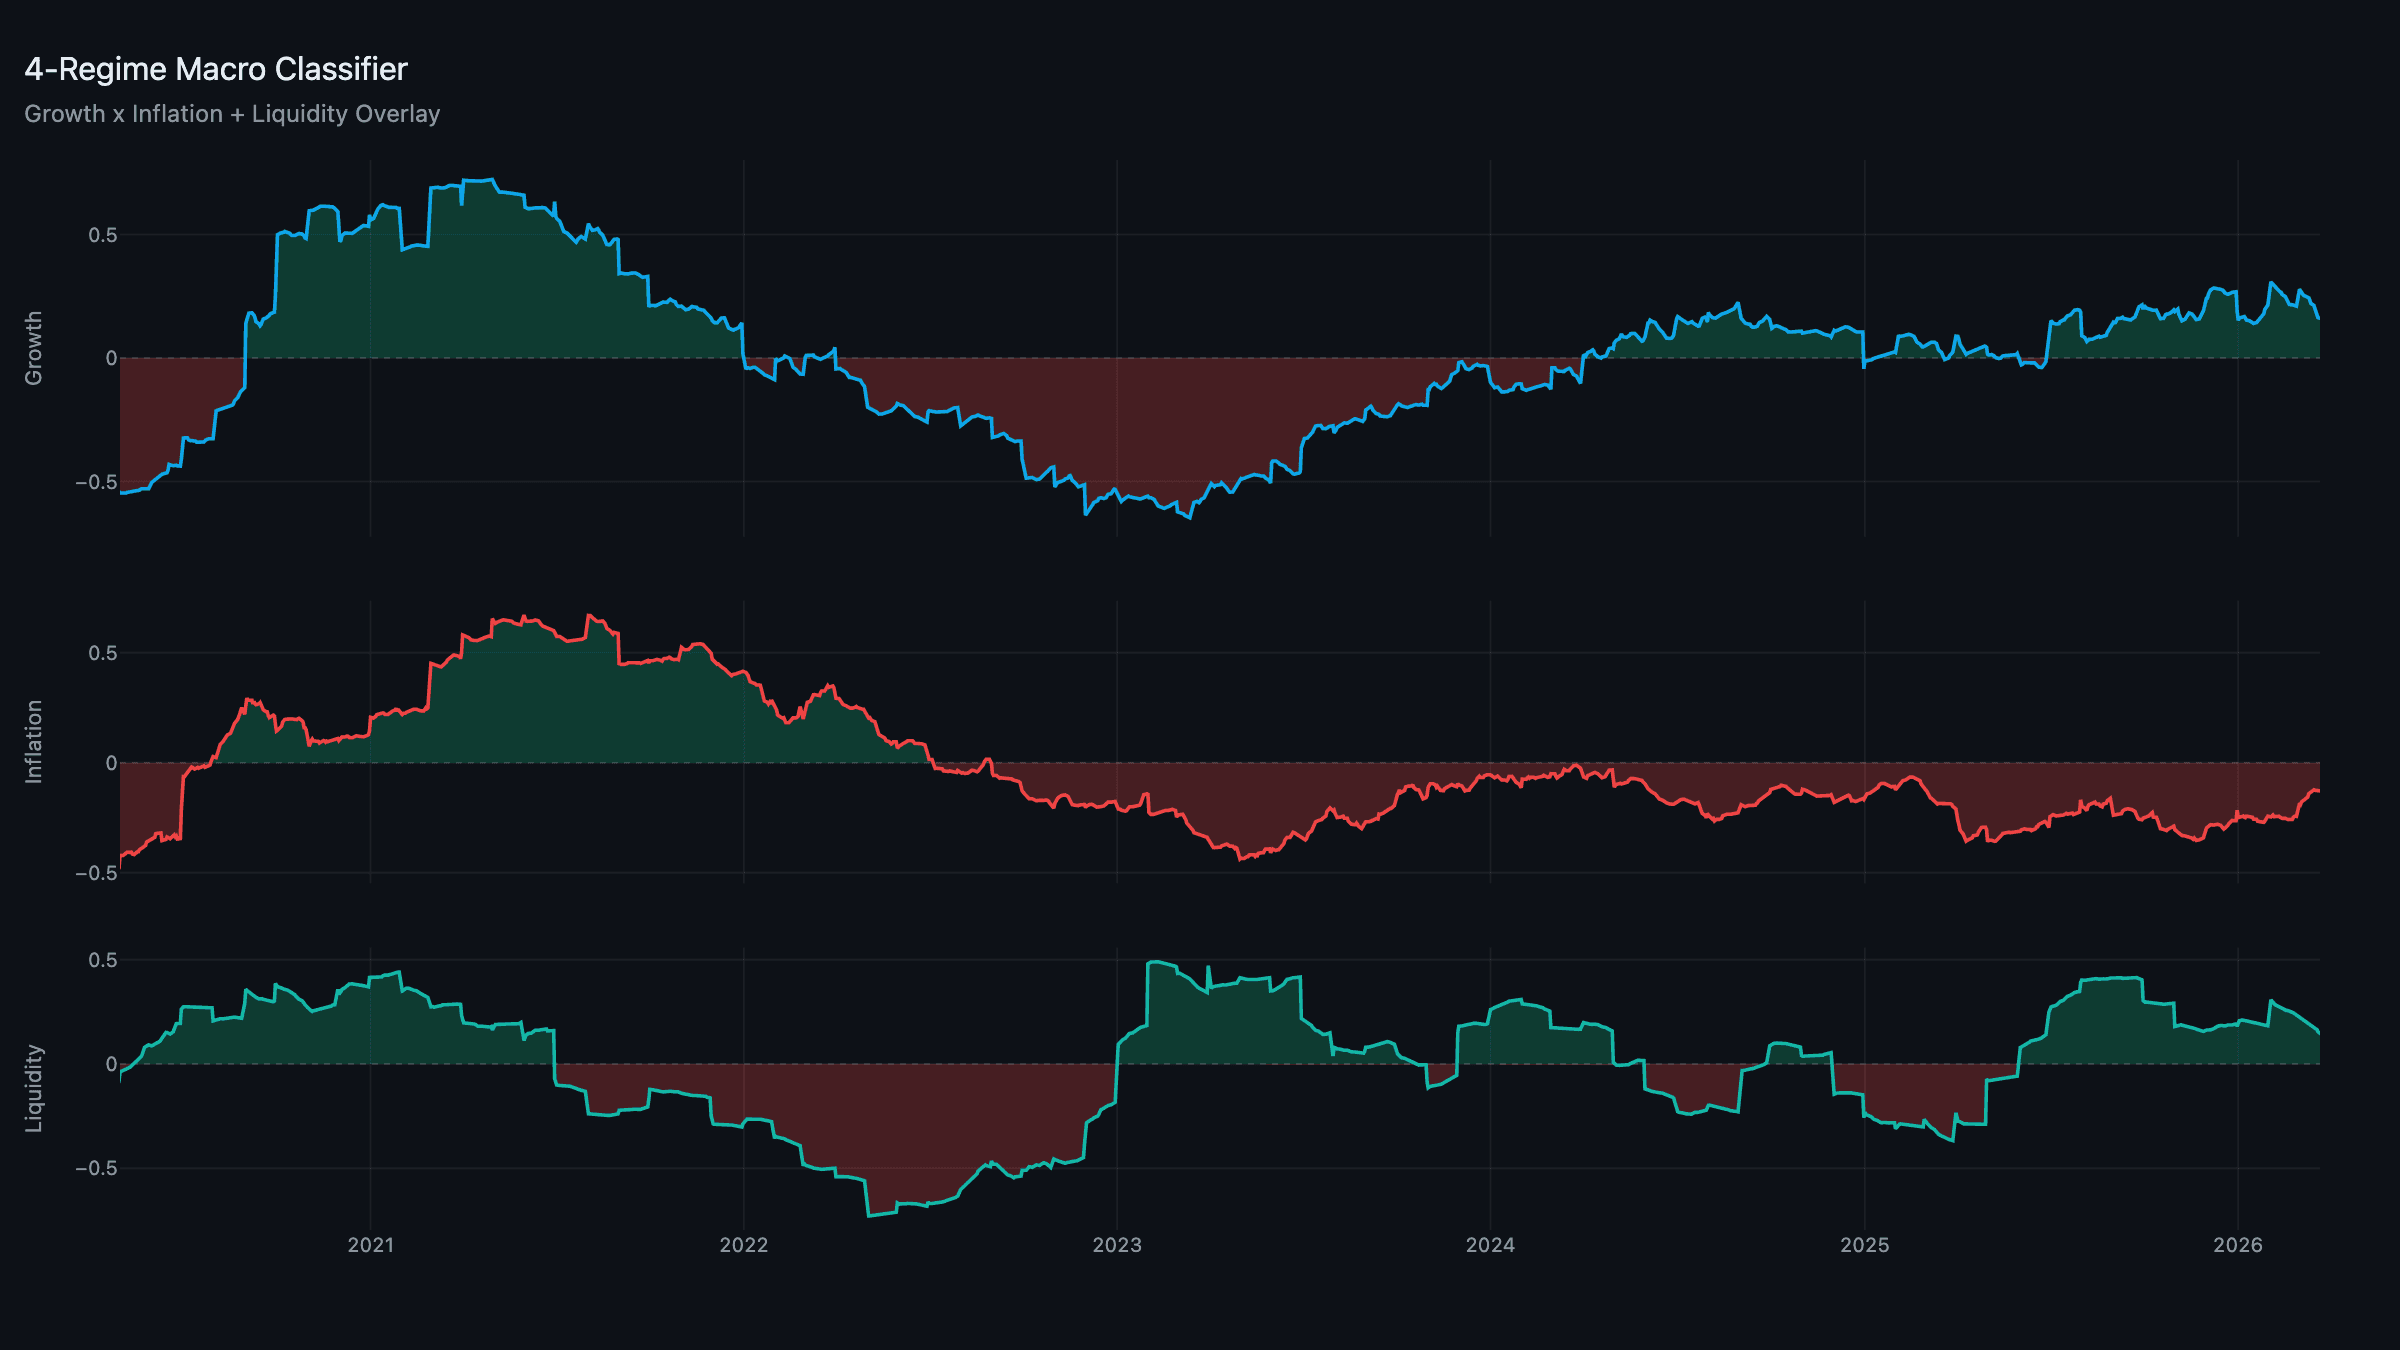
Growth: The Slow Grind, But Still Positive
Growth eased to +0.16, a third straight weekly drift lower, but still firmly in expansion. Production is the soft spot: March regional surveys disappointed, with the Philadelphia Fed manufacturing index at −8.7, its worst in 14 months, new orders weak and input prices rising. That's the factory-level pressure point.
The leading pillars are what keep the composite positive. Corporate capex holds firm on the AI build-out (Microsoft announced another $18B data-center commitment this week) and input-acquisition, though drifting, is still the strongest pillar on export momentum. Financial conditions tightened modestly after the hawkish FOMC: the 10-year jumped to 4.45% and high-yield spreads widened ~15bps, but neither is at an alarming level. The economy is decelerating, not rolling over.
Inflation: Hawkish Fed, Narrow Pressure
The Fed's March SEP revised 2026 core PCE up to 2.8% (from 2.5% in December). An acknowledgment that the supply-side impulse is real. The composite agrees that pipeline pressure is building: PPI ran hot at +0.5% MoM, energy and intermediate goods leading, and a softer dollar (DXY 99.8) amplifies imported costs.
But the composite still nets −0.13, because the offsets are large. Services inflation remains disinflationary (it has stopped falling, which is worth watching, but it's not rising), and demand-pull pressure is negative as the consumer retrenches. The inflation story is entirely about a narrow energy/goods channel. Exactly the kind of pressure that keeps the regime in Goldilocks until it broadens. The thing to watch is services: if it stabilizes here while energy keeps climbing, the composite grinds toward positive.
Liquidity: Still Expanding
Liquidity holds at +0.16. The hawkish Fed repriced the front end, but the broad liquidity engine (balance sheets, credit flow, cross-border dollar funding, and a still-calm collateral/funding pillar) is expanding. A weaker dollar is the assist, easing offshore dollar conditions. This is the leg that keeps a modest-growth, low-inflation economy supported, and it's the reason the book can stay risk-on through a hawkish meeting.
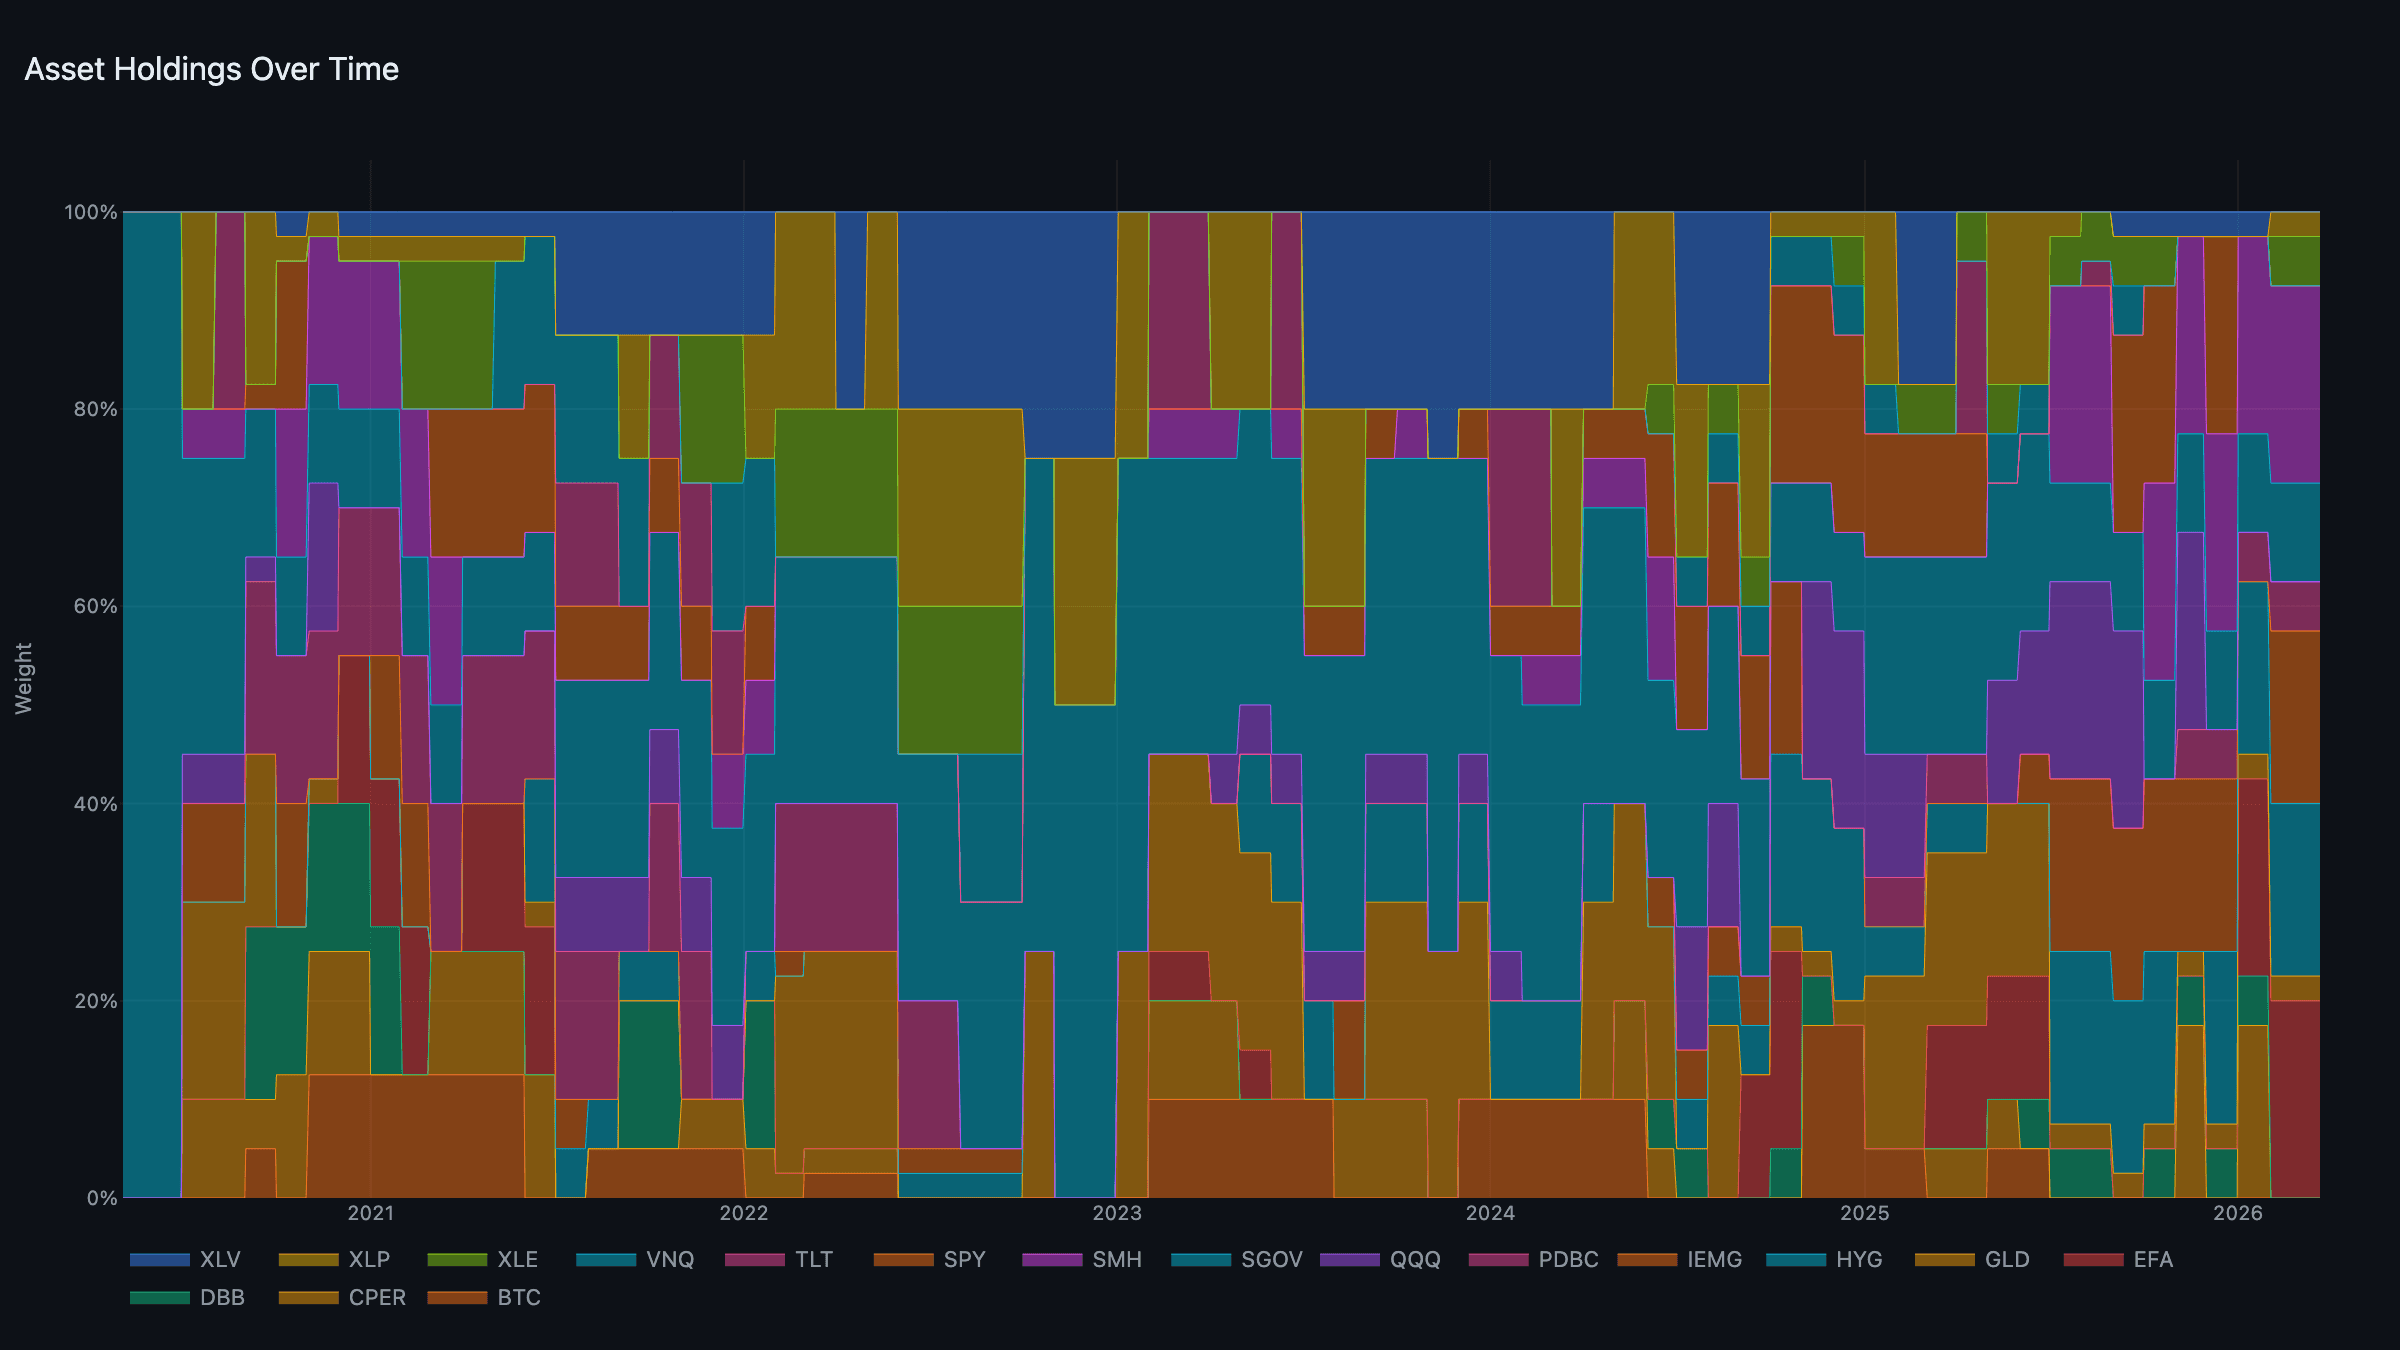
The Portfolio: Risk-On, Gold as Ballast
Goldilocks/Expanding keeps the heaviest weights on growth and liquidity:
- Growth: EFA + SMH (~20% each).
- Liquidity: IEMG + HYG (~17.5% each).
- Real assets: XLE + PDBC, capturing the oil and commodity bid.
- Defensive: XLP + GLD, a light ballast.
- Cash: SGOV, 10%.
Gold at $5,180 (+2.6% on the week) is doing exactly what the thesis says it should. The hawkish "higher for longer" message paradoxically helps it, because a Fed that can't cut while the Treasury still has to roll trillions is the debt-refinancing bind in plain view. But in a Goldilocks regime gold wins only a small defensive slot, not the anchor weight. The S&P at 6,518 (down 5.3% from January) and bitcoin at $73,500 (bid on the SEC's move to accept spot ETH ETF applications) sit behind the ex-US, EM, and semiconductor names the tournament prefers.
Week Ahead: Tariff Clarity and PCE
- Consumer Confidence (Mar 25): After last month's slide to 92.9, further deterioration would pressure the growth composite.
- Core PCE, February (Mar 28): The Fed's preferred gauge. Given the hot PPI, an upside surprise is the risk and would push the inflation composite toward the threshold.
- Section 301 preliminary findings (Mar 27): Whether tariffs widen beyond China is a direct input to the pipeline-costs channel.
- Iran / Red Sea: Oil is the master variable. A de-escalation cools the energy channel and entrenches Goldilocks. A sustained shock is what would eventually flip inflation positive.
All model scores are normalized to a [-1, +1] scale through our proprietary normalization methodology. Positive readings indicate above-trend expansion. Negative readings indicate below-trend contraction. Data updated through March 20, 2026.
MacroScope models are systematic tools, not investment advice. Past performance does not guarantee future results.