MacroScope Weekly — March 15, 2026
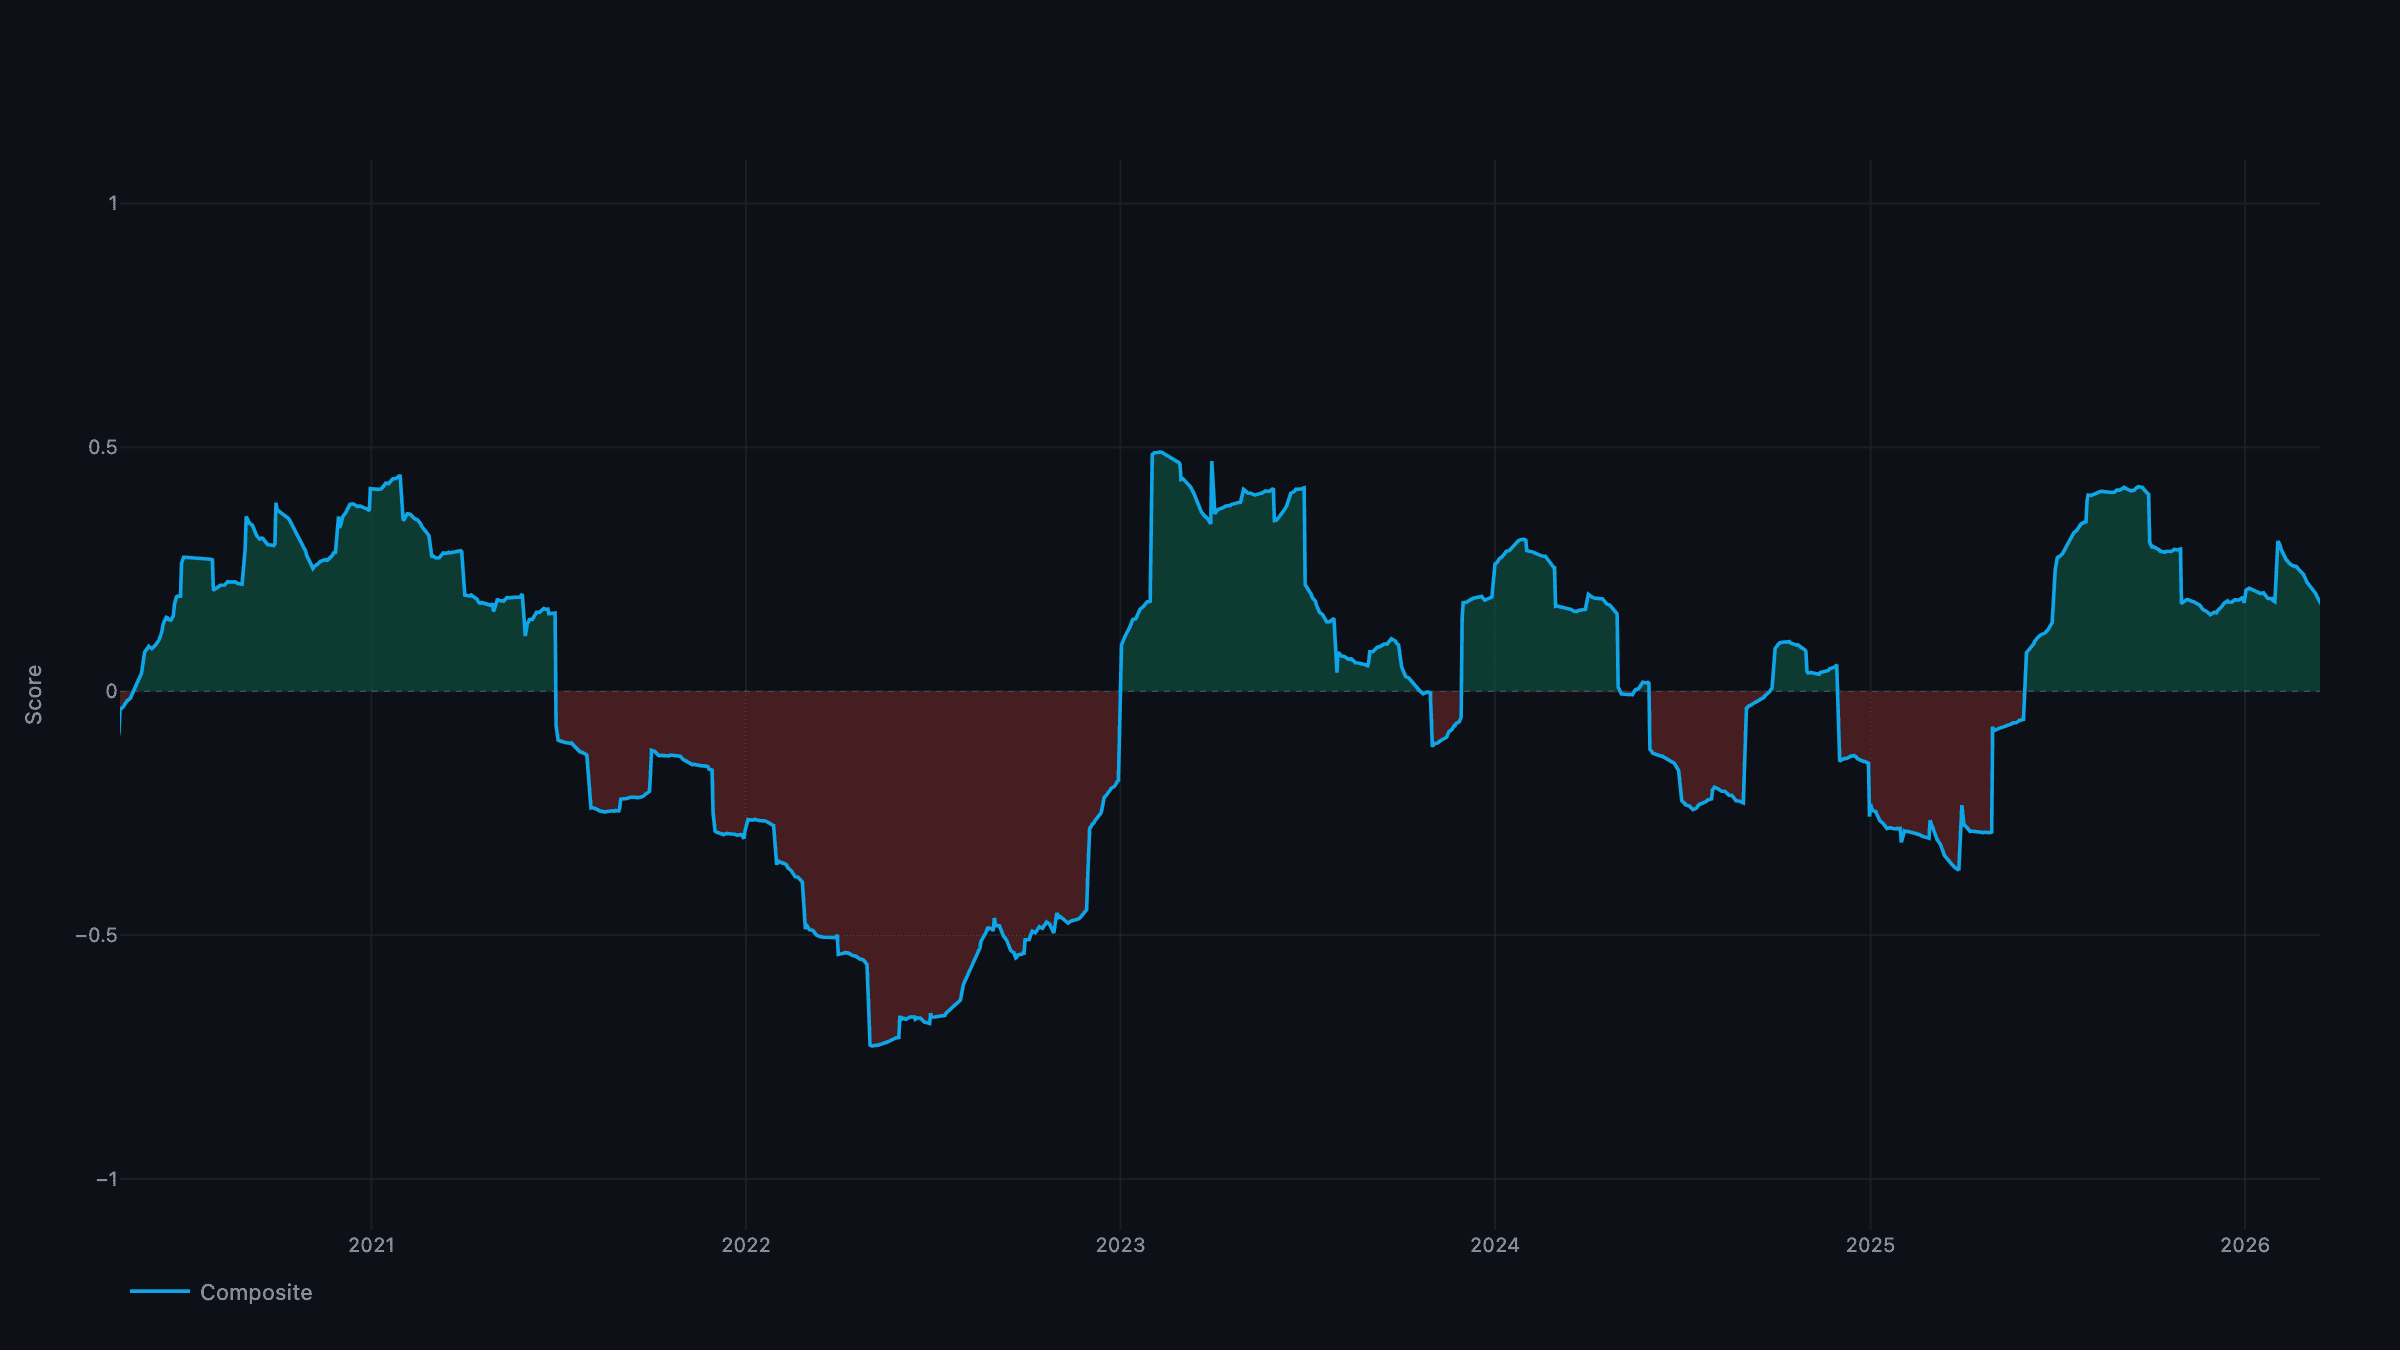
Current Regime: Goldilocks / Expanding Liquidity
TL;DR: Growth is positive and broadening, the inflation composite is below trend, and liquidity is firmly expanding — that combination is textbook Goldilocks. It may not feel like it with US and Israeli forces at war with Iran and the Strait of Hormuz disrupted, but the data underneath the headlines is constructive: the energy spike is isolated in one pipeline-costs channel while demand, expectations, and services are disinflationary, so the aggregate inflation read is negative. The book is risk-on and globally tilted — no flight to cash.
The Regime: Goldilocks
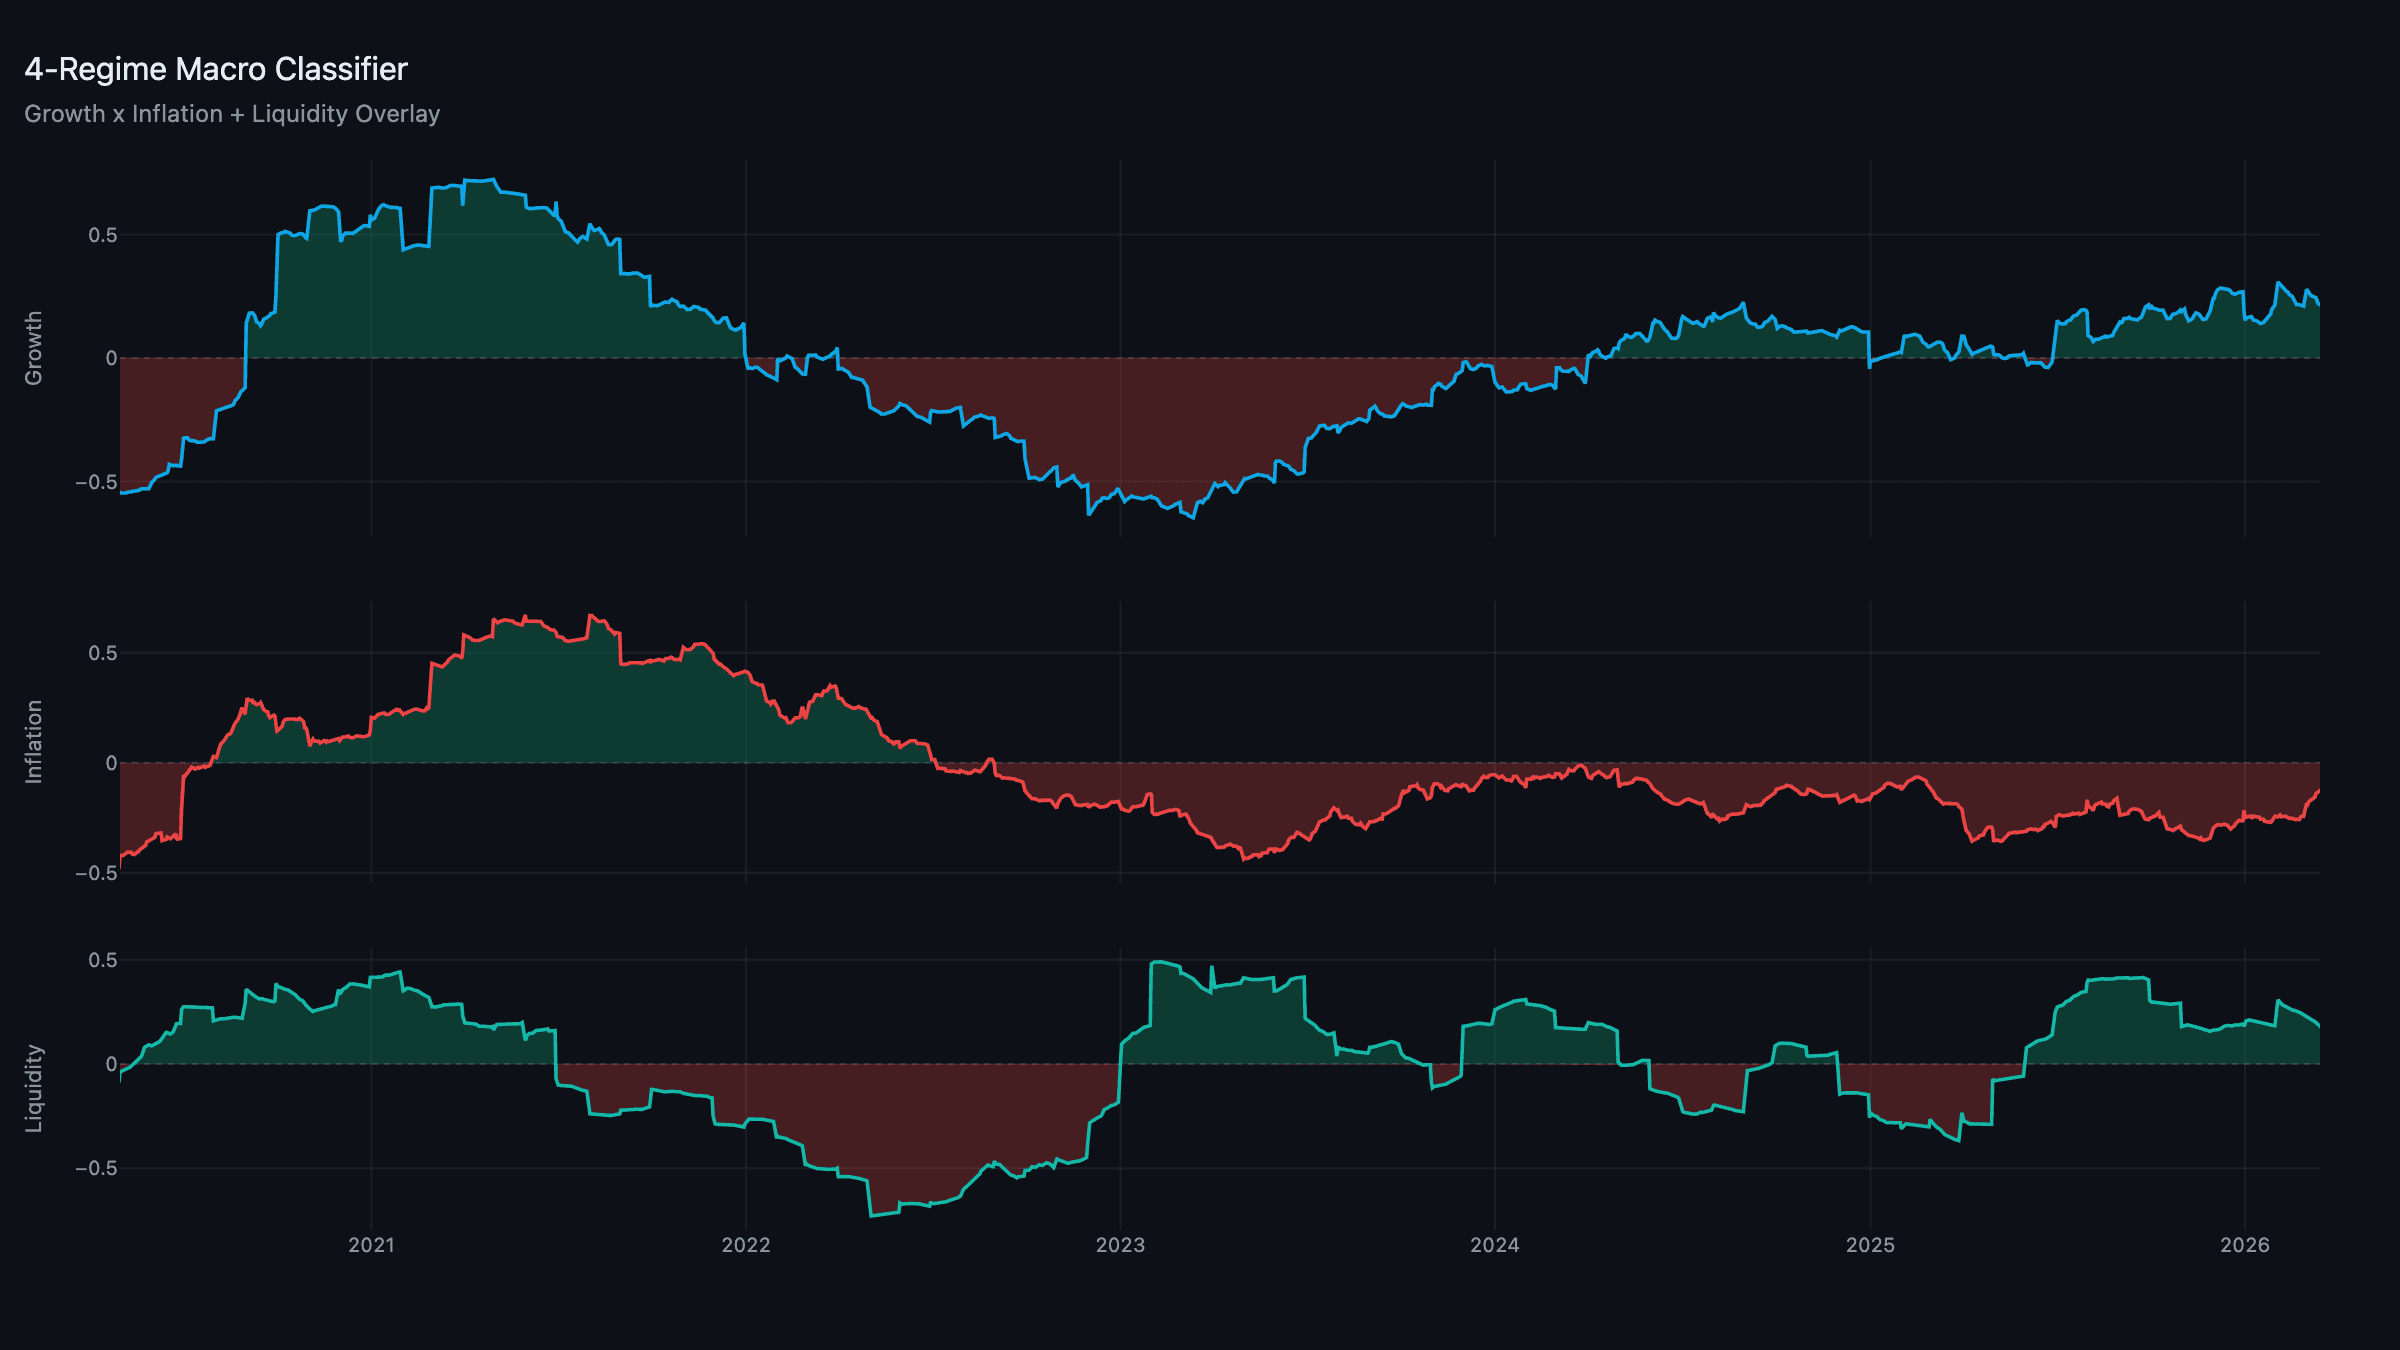
The classifier reads Goldilocks with Expanding Liquidity — growth positive, inflation negative, global liquidity positive.
Growth: +0.22 | Inflation: −0.14 | Liquidity: +0.19
The inflation read is the interesting one. With Brent near $98 after the Iran conflict disrupted Strait of Hormuz traffic, the instinct is to expect a hot inflation print. But the rebuilt composite weights the breadth of pressure, and right now the breadth isn't there: the energy spike lands in pipeline costs, while demand pressure, expectations, and services inflation are all soft. Strip nothing out — the composite simply nets negative. That's why this is Goldilocks, not Reflation. The risk is obvious: a sustained oil shock that broadens into expectations and services would flip it.
Growth: Modest, With Production the Soft Spot
Growth at +0.22 is positive but unspectacular, and the pillar mix explains why. Production is the laggard — February's jobs report confirmed it, with the economy shedding 92,000 jobs (the third monthly loss in five months) and manufacturing down 12,000. Consumer confidence has slipped to 92.9, with the expectations sub-index well below the recession-warning threshold.
What's holding the composite up is the front end of the pipeline: the decision/capex pillar and input-acquisition are strong, carried by hyperscaler digital capex and resilient Korean/Taiwanese export momentum. The new Section 301 trade probes launched March 11 — targeting "structural excess capacity" across China, the EU, and others — and the additional 10% China tariff that took effect March 4 add friction, but haven't yet bent the leading pillars. The picture: an economy still expanding on investment and supply-chain momentum, with production the pillar to watch.
Inflation: An Isolated Energy Spike
The inflation composite at −0.14 is the cleanest illustration of the framework's "level vs. breadth" design. Oil near $100 — Brent up roughly 40% since pre-conflict levels — and a softer dollar (DXY 100.33) are pushing the pipeline-costs channel up. But that's one channel. Services inflation is strongly disinflationary as the labor market cools (unemployment 4.4%, negative payrolls), and demand pressure is outright negative — consumers are retrenching, not overheating. Expectations remain anchored.
So the energy shock is real but narrow. Until it broadens into wages, rents, and expectations, the composite reads below trend, and the regime stays Goldilocks. This is exactly the kind of supply-driven impulse the model is built to keep in perspective rather than chase.
Liquidity: Expanding
Liquidity is the strongest leg at +0.19. Central-bank balance sheets are flat-to-growing, credit is flowing, and the rebuilt cross-border and collateral/funding pillars aren't flagging stress despite the geopolitics. A softer dollar is easing offshore dollar funding. Quantitative tightening is effectively over and the Fed is on hold — but the quantity of liquidity, which is what the composite measures, is expanding.
Expanding liquidity is the green light that lets a modest-growth, low-inflation economy support risk assets. It's the difference between "the economy is growing" and "there's fuel for asset prices" — and right now we have both.
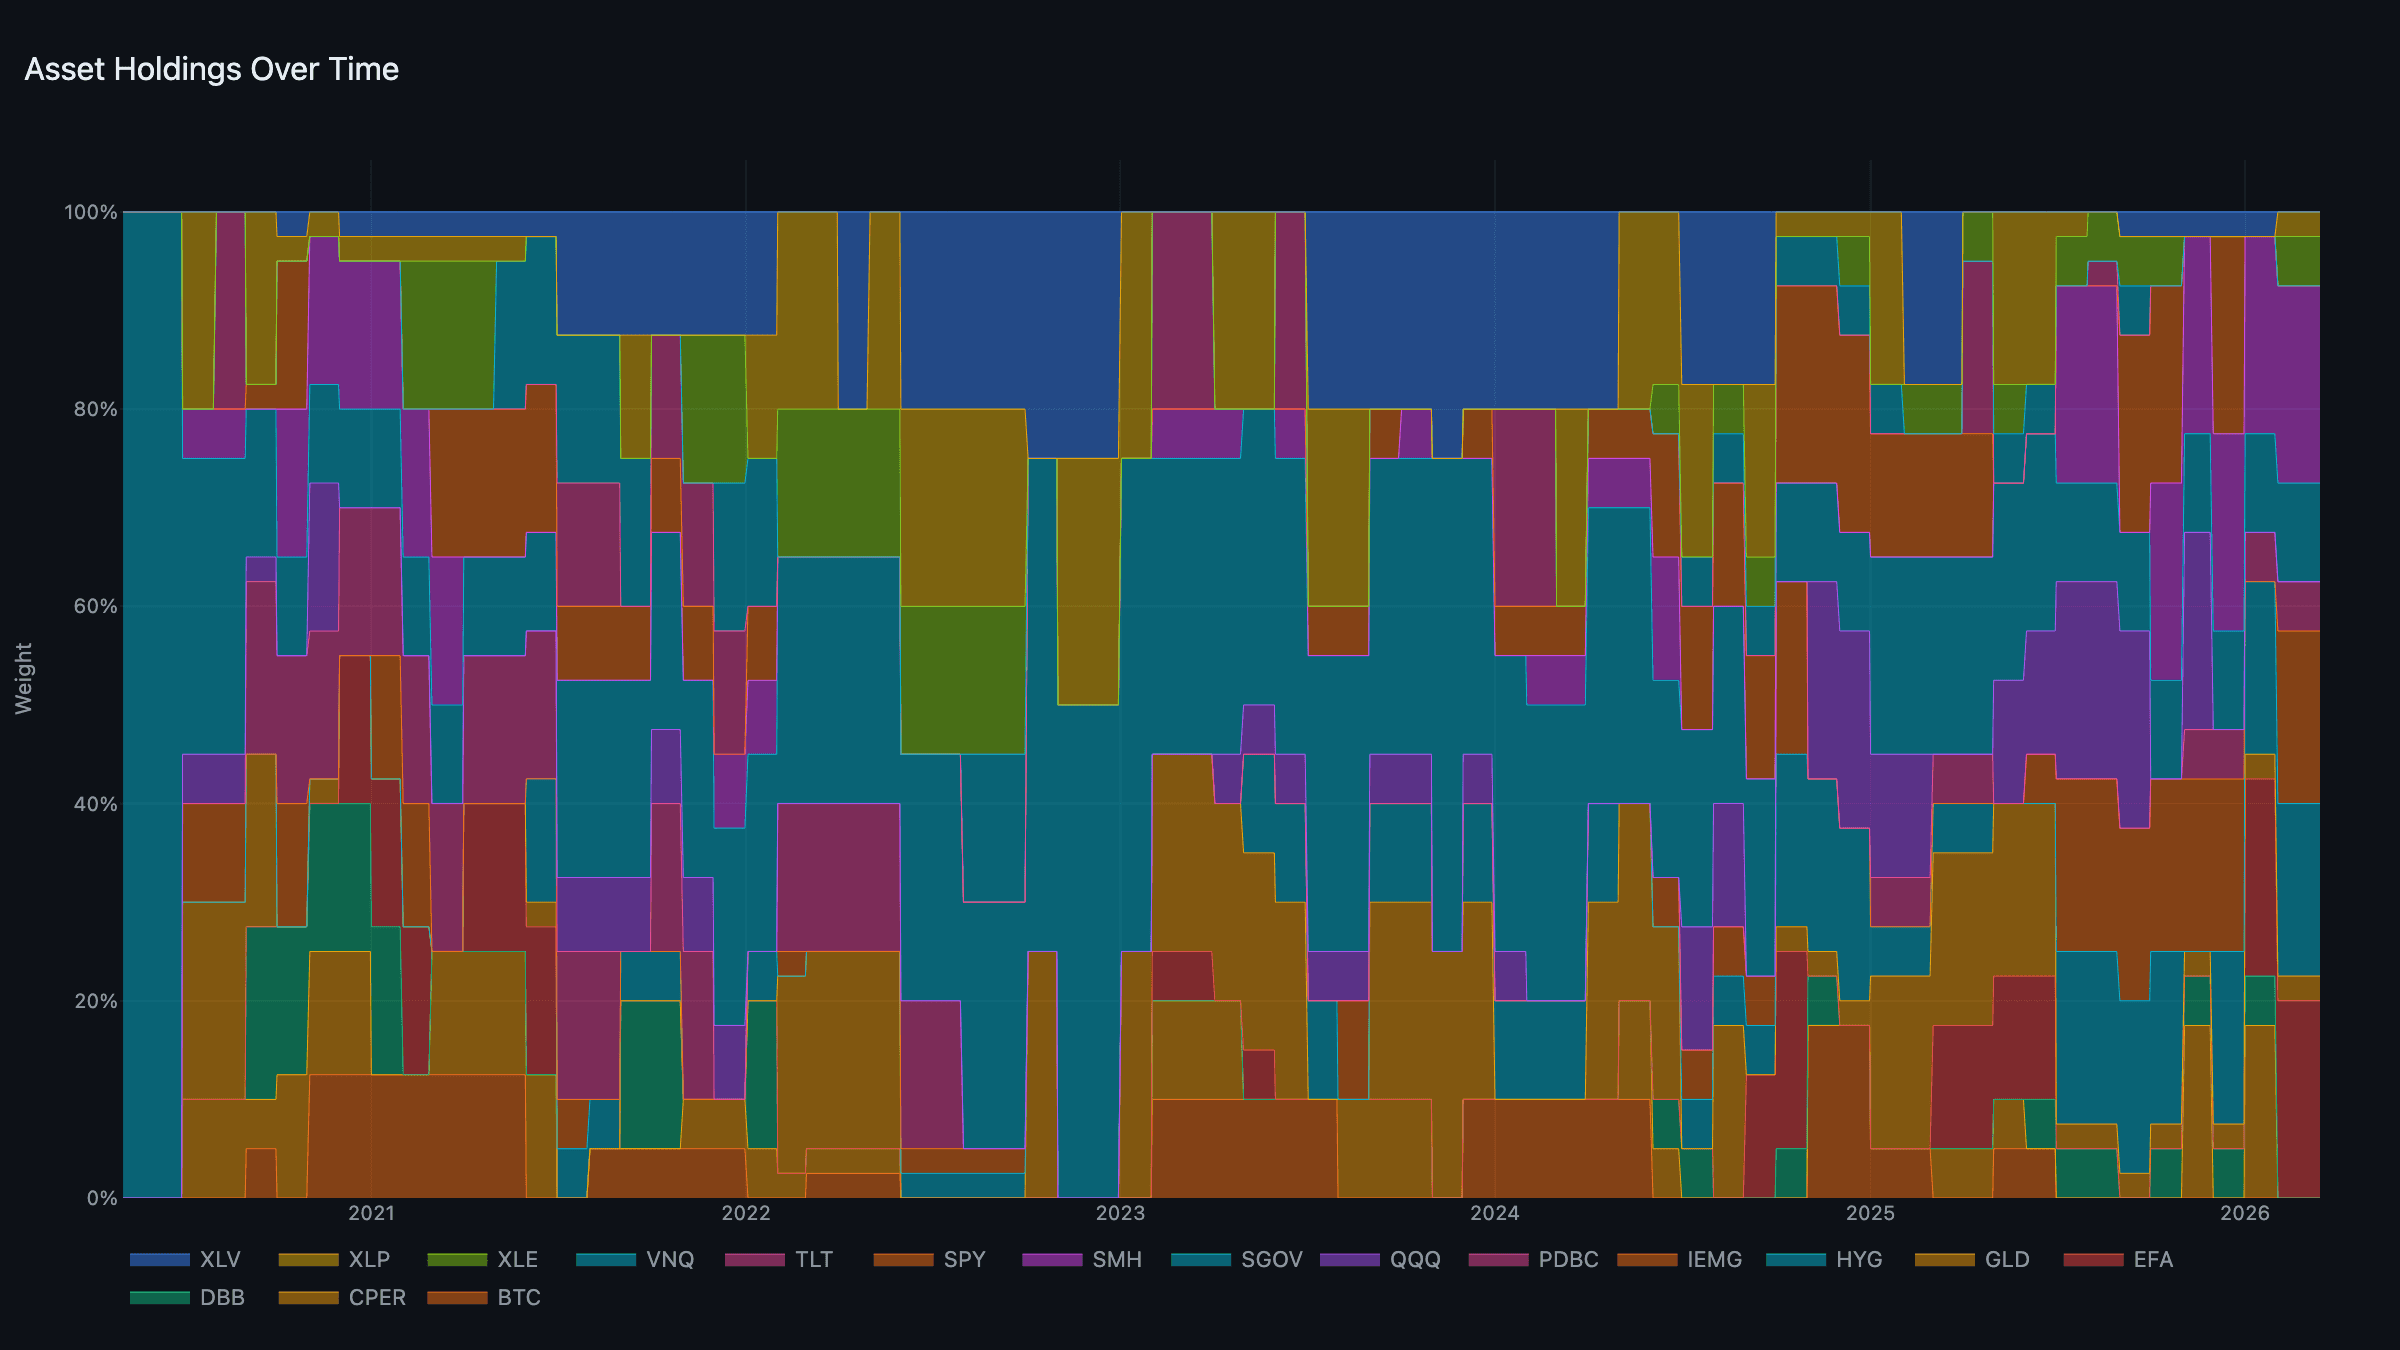
The Portfolio: Risk-On, Globally Tilted
Goldilocks/Expanding puts the heaviest sleeve weights on growth and liquidity, and the tournament holds the two strongest names in each pool:
- Growth (heaviest): EFA + SMH — developed-ex-US equity and semiconductors, ~20% each.
- Liquidity: IEMG + HYG — emerging markets and high-yield credit, ~17.5% each.
- Real assets: XLE + PDBC — energy and commodities capturing the oil bid.
- Defensive: XLP + GLD — a light staples/gold ballast.
- Cash: SGOV at 10%.
The point worth stressing: the model is not hiding in cash despite the war. Gold ($5,050, record central-bank buying, Goldman's target lifted to $5,400) is in the book but as a small defensive holding, not the anchor — in Goldilocks it doesn't win a heavy weight. The S&P at 6,642 (down 3.4% from its January high) and bitcoin at $71,000 (fresh off the SEC/CFTC MOU classifying BTC and ETH as digital commodities) sit behind the ex-US and EM names the tournament actually prefers. VIX at 27.58 says nervous, not panicked.
Week Ahead: Central Bank Super Week
- FOMC (Mar 17–18) + dot plot: A hold at 3.50–3.75% is near-certain; the projections are the event. An energy shock on top of a strong-ish economy leaves little room to ease — watch how hawkish the dots lean.
- February PPI (Mar 18): First read on whether the oil shock is transmitting upstream into producer prices.
- BoJ / ECB / BoE (Mar 19): Three majors on one day. Divergence between a hawkish BoJ and dovish ECB could move FX — and the dollar feeds straight back into our pipeline channel.
- Iran / oil: The swing variable for the whole regime. A ceasefire deflates the energy impulse and entrenches Goldilocks; a broadening shock is what would tip inflation positive.
All model scores are normalized to a [-1, +1] scale through our proprietary normalization methodology. Positive readings indicate above-trend expansion; negative readings indicate below-trend contraction. Data updated through March 13, 2026.
MacroScope models are systematic tools, not investment advice. Past performance does not guarantee future results.